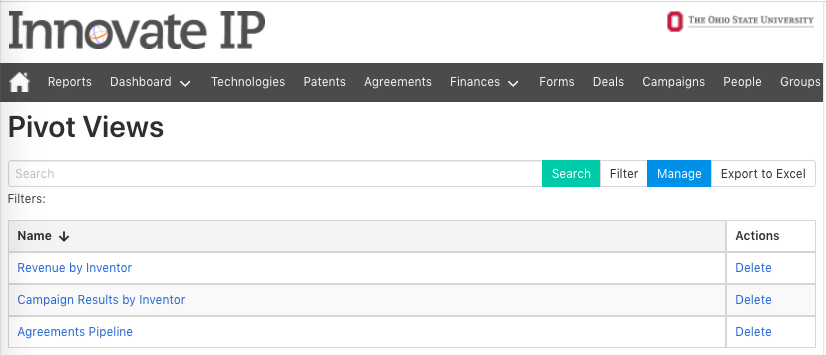
My Pivot Views
Create a Pivot View
Users who are familiar with Pivot Tables in Excel can take advantage of Innovate IP’s built-in Pivot View feature which allows users to create graphs, reports, and pipelines for just about any data stored in the Innovate platform.
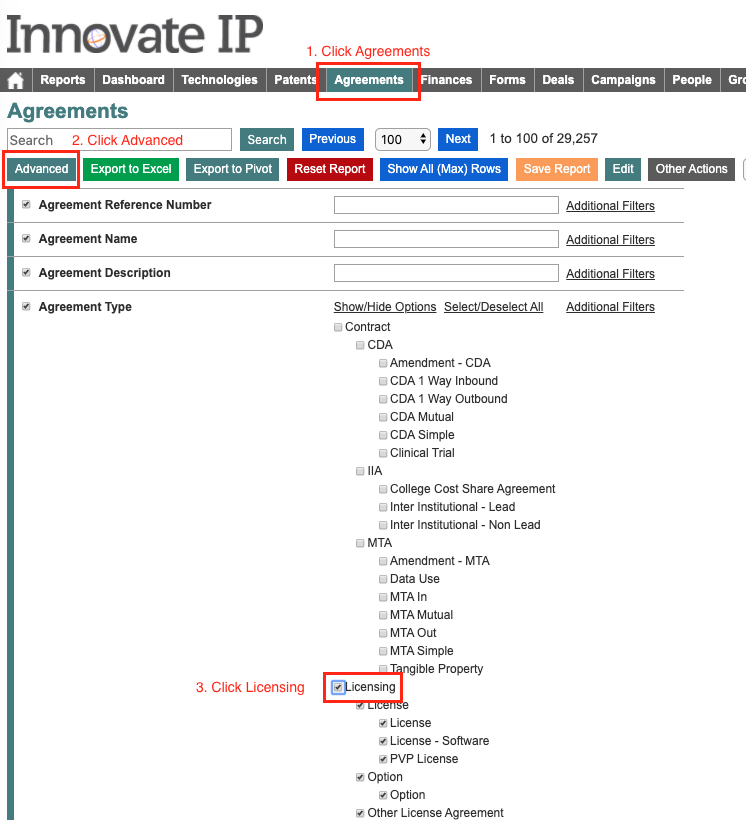
As an example, to create a pipeline view of license agreements, navigate to the Agreements Search Page, click Advanced and select the criteria for search (Agreement Type = Licensing; Latest Agreement Workflow Type = Check).
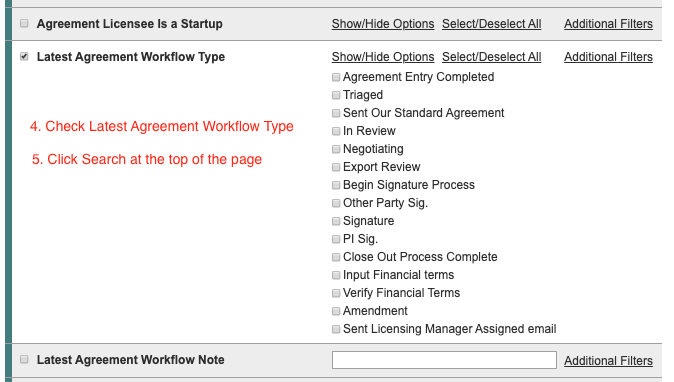
When your results appear, click the Export to Pivot button to generate the Pivot View. You can also click the Save Report button to save this search or share it with others.

After you click the Export to Pivot button, you will see an interface that will allow you to create the pivot table.
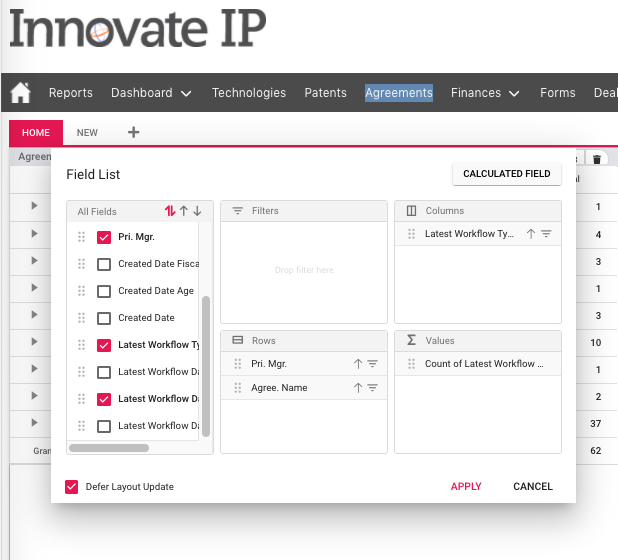
Selecting “Pri. Mgr.” and “Agree. Name” and place them in the rows section. Select “Latest Workflow Type” for the columns and count of “Latest Workflow Type” in the Values section. You can use the filter and ordering icons to further manage the results.
After clicking Apply, you will see your results in a table format with triangle icons that allow you to drill down into the underlying data. You can also view your chart as a variety of graphs and you can export the results to Excel, PDF or CSV formats.
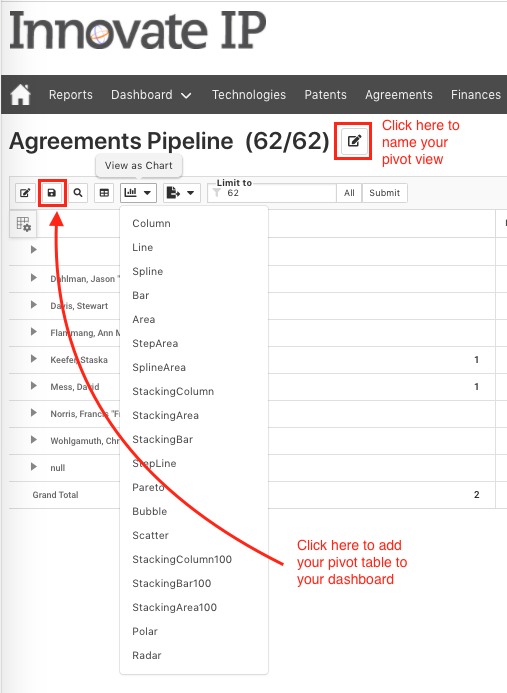
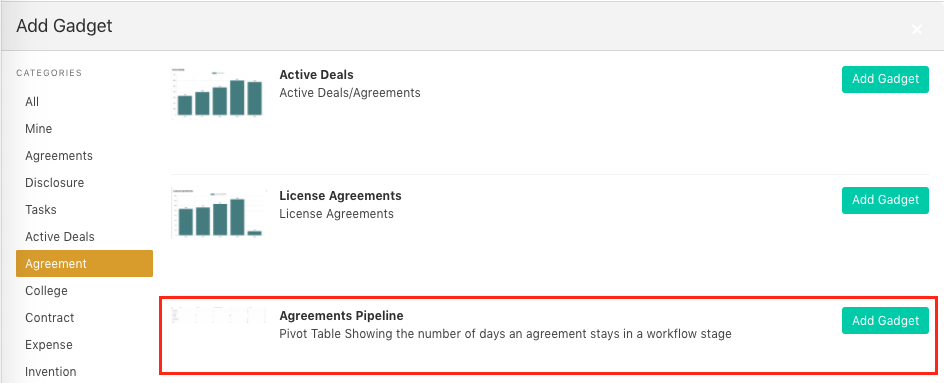
Now you are ready to add the gadget to your Dashboard (see My Dashboard).
Pivot Views are managed by hovering your mouse over the Dashboard Menu Button and selecting the dropdown button “My Pivot Views”

Here you will find a management module for editing, deleting, exporting and sharing your pivot views.
